Learn how to analyze user feedback at scale using qualitative and quantitative methods, tagging frameworks, prioritization models, and real examples.
User feedback analysis sounds simple until you try to do it at scale. Most product teams are great at collecting feedback. They run surveys, read support tickets, and log feature requests. The breakdown happens after that. Feedback piles up across tools, formats, and channels, and no one has a clear way to turn it into decisions.
The problem isn’t a lack of data. It’s the gap between raw input and usable insight. Teams skim comments, chase loud requests, or rely on gut feel because proper analysis feels slow and manual. As volume grows, learning actually decreases.
This guide is for product managers, SaaS teams, and CX leaders who want a better system. We’ll cover how to analyze user feedback at scale, combine qualitative and quantitative data, apply tagging and prioritization frameworks, avoid common mistakes, and use tools like Frill to bring structure to the chaos.
What is user feedback analysis?
User feedback analysis is the process of systematically reviewing, organizing, and interpreting feedback from users to uncover actionable product insights. It goes beyond reading individual comments. The goal is to identify patterns, trends, and signals that can guide product decisions with confidence.
User feedback and customer feedback often overlap, but the distinction matters in some contexts. Users are anyone interacting with your product. Customers are the people who pay for it. In SaaS, they’re often the same, but not always. A power user may surface usability issues, while a buyer may focus on pricing or reporting. Good analysis accounts for both perspectives without treating every request the same.
Strong user feedback analysis doesn’t produce a long list of opinions. It produces clarity. You should come away knowing which problems are widespread, which affect key segments, and which align with your strategy. Instead of reacting to the loudest voices, you focus on validated signals that help you prioritize work, explain tradeoffs, and build a roadmap grounded in real user needs.
Two types of user feedback data to analyze
User feedback comes in many forms, but it generally falls into two categories: qualitative and quantitative. Understanding the difference is essential because each type answers a different question. Strong analysis uses both.
1. Qualitative user feedback (the “why”)
Qualitative feedback explains why users feel the way they do. It’s descriptive, contextual, and often emotional. This is where users tell you what’s working, what’s broken, and what’s missing.
Common sources include:
Support tickets and live chat conversations
NPS and CSAT comments
User interviews and usability tests
The strength of qualitative feedback is depth. It reveals root causes, unmet needs, and language you can use in product decisions and messaging. It’s also where early signals appear before metrics move.
The limitation is scale. Qualitative feedback is unstructured and time-consuming to review. It’s easy to miss patterns or overweight memorable comments. Without a system for tagging and grouping, teams rely on anecdotes instead of evidence. That’s why most meaningful insights live here, but many teams struggle to extract them consistently.
2. Quantitative user feedback (the “how much”)
Quantitative feedback measures how often something happens or how many users are affected. It provides structure and comparability.
Typical examples include:
Ratings and survey scores
Multiple-choice survey responses
Feature votes and request counts
Usage and behavioral metrics
Quantitative data shines when you need to size a problem, track change over time, or compare options. It helps you validate whether an issue is widespread or isolated.
The risk is misinterpretation. Numbers rarely explain intent on their own. High volume doesn’t always mean high impact, and low volume doesn’t mean low importance.
Why you need both to make confident decisions
Qualitative feedback tells you what’s wrong and why. Quantitative feedback tells you how much it matters. Together, they reduce guesswork.
For example, a few detailed complaints may reveal a critical workflow issue. High vote counts can confirm it affects many users. One without the other leads to either overreaction or missed opportunities.
The core challenges of user feedback analysis
User feedback analysis is rarely hard in theory. It becomes difficult in practice because of volume, messiness, and human bias. Most product teams face the same set of challenges as feedback scales.
First, feedback is largely unstructured. It shows up as free-text comments, emails, tickets, and messages. There’s no consistent format, which makes it hard to compare or aggregate insights without manual work.
Second, many requests are duplicate, vague, or emotionally charged. Users describe symptoms, not root causes. Ten messages may describe the same problem in different ways, while others ask for solutions that don’t align with your product strategy.
Third, feedback is scattered across tools and teams. Support, sales, success, and product each see a slice of the picture. Without a shared system, no one has full context, and insights get lost or repeated.
Bias compounds the problem:
Loud users can outweigh silent majorities
Recent feedback feels more urgent than long-standing issues
Internal opinions fill gaps when data feels unclear
Finally, spreadsheets and inboxes don’t scale. They lack structure, history, and visibility. As feedback grows, they slow analysis instead of supporting it. Without a purpose-built system, teams spend more time sorting feedback than learning from it.
How to analyze user feedback at scale (step-by-step)
Analyzing user feedback at scale requires a system, not more effort. The goal is to reduce fragmentation so patterns become obvious and decisions become easier.

Step 1: Centralize all user feedback in one place
Feedback analysis fails when there is no single source of truth. When input lives across tools, teams end up reacting to whatever they saw most recently instead of what matters most. Centralization is the foundation for every step that follows, because you can’t analyze patterns you can’t see.
User feedback typically comes from many places:
In-app feedback and feature requests
Email conversations and shared inboxes
Support tickets and live chat
Sales notes and CRM fields
Social media comments and reviews
When these sources stay siloed, the same issue shows up repeatedly without context. Support may flag a problem that product never sees. Sales may promise a fix that isn’t prioritized. Product decisions get made based on partial information, which increases rework and internal debate.
Tools like Frill solve this by pulling feedback into a single system and preserving its source, context, and history. Instead of chasing messages across tools, product managers can review feedback holistically, spot trends faster, and align teams around the same data. Once feedback lives in one place, meaningful analysis becomes possible.
Step 2: Create a scalable feedback tagging framework
Once feedback is centralized, tagging is how you turn raw input into structured data. Feedback tags are labels you apply to user input so it can be grouped, analyzed, and compared over time. They help you move from reading comments one by one to identifying patterns across hundreds or thousands of responses.
Tags are not summaries, interpretations, or decisions. They shouldn’t describe what you plan to do. They exist to classify what users are telling you in a consistent, repeatable way.
A scalable tagging framework usually includes a small set of core categories:
Problem or pain point
Feature or product area
User segment or plan type
Sentiment (positive, neutral, negative)
Urgency or impact
For a SaaS product, a single piece of feedback might be tagged as “onboarding friction,” “dashboard,” “self-serve users,” “negative,” and “high impact.” Over time, these tags make trends obvious without rereading every comment.
The key is restraint. Teams often over-tag in an effort to capture nuance. That approach breaks down quickly. Too many tags create inconsistency, slow adoption, and make analysis harder, not easier. Fewer, well-defined tags lead to cleaner data and more reliable insights.
Consistency matters more than precision. When everyone applies the same tags in the same way, patterns emerge naturally. Tools like Frill support this by making tagging fast, visible, and shared across the team, which keeps feedback analysis structured as volume grows.
Step 3: Analyze themes, not individual requests
Individual feedback items are easy to react to, but they rarely tell the full story. Scalable analysis means shifting your focus from single requests to recurring themes. Patterns reveal underlying problems. Anecdotes only create noise.
Themes emerge when you look across tagged feedback instead of reading items in isolation. A single complaint about slowness may not seem urgent. Fifty small complaints, spread across weeks and channels, usually point to a deeper usability or performance issue. This is where structured tagging starts to pay off.
Common signals that indicate a theme is forming include:
Repeated mentions of the same workflow or feature
Different users describing the same problem in different words
Issues appearing across multiple feedback sources
Increasing frequency over time
For example, users may not say “navigation is unclear.” Instead, they mention getting lost, clicking the wrong page, or needing extra steps to complete a task. Individually, those comments feel minor. Grouped together, they clearly indicate a navigation problem worth prioritizing.
Tools like Frill make theme analysis easier by allowing you to group feedback by tags, sort by volume or impact, and review trends over time. Instead of scanning hundreds of requests, you can quickly see which problems repeat, which are growing, and which affect key user segments. This shift from reacting to comments to analyzing themes is what turns feedback into reliable product insight.
Step 4: Layer in quantitative signals
Quantitative signals add context to qualitative insights by showing how widespread a problem is and which users it affects.
Use numbers to size the problem
Once themes are clear, quantitative signals help you understand scale. Votes, frequency, and customer segment size show how many users are affected and who they are. This step adds weight to qualitative insights without replacing them. A well-described problem becomes far more actionable when you can quantify its reach.
Connect volume to business impact
High volume alone isn’t enough. A request from ten enterprise customers may matter more than one hundred from free users. Look at where feedback comes from, how often it appears, and which segments it affects. When you tie volume to revenue, retention, or strategic goals, prioritization becomes less subjective and easier to defend.
Balance niche and widespread requests
Not all valuable feedback shows up at scale. Some issues are critical but limited to a specific workflow or user type. Quantitative data helps you see the tradeoff clearly. A widespread request may improve overall usability, while a niche request may unblock adoption for a high-value segment. The goal isn’t to chase the biggest number. It’s to combine qualitative insight with quantitative context so you can make informed, intentional decisions rather than reacting to noise.
Step 5. Prioritize user feedback
Prioritization is where user feedback turns into real product decisions, and it’s also where many teams get stuck debating opinions instead of tradeoffs.
Popular prioritization models (with pros & cons)
Product teams use prioritization frameworks to bring structure to those tradeoffs, especially when feedback volume is high and resources are limited. These models don’t make decisions for you, but they help teams align on why one initiative moves forward over another.
RICE (Reach, Impact, Confidence, Effort): Strong for data-informed teams that want a repeatable scoring system. It encourages rigor, but scoring can feel subjective if inputs aren’t well defined.
ICE (Impact, Confidence, Ease): Faster and simpler than RICE. Useful for early-stage teams, though it can oversimplify complex decisions.
Value vs Effort: Easy to understand and communicate. It works well for roadmap discussions, but it lacks nuance around user segments and strategic impact.
Kano model: Helps distinguish between basic expectations and delight features. It’s great for user satisfaction, but less effective for ongoing prioritization without frequent user research.
No framework is perfect on its own. The best teams treat these models as decision-support tools, not scoring exercises. When combined with well-analyzed user feedback, they provide a shared language for prioritization and reduce friction when tradeoffs are unavoidable.
A practical prioritization framework for user feedback
Most teams don’t need another scoring model. They need a lightweight framework that combines user signals with business context and is easy to apply consistently. This approach works well for feedback-driven roadmaps because it balances insight with execution reality.
Frequency: How often the same problem or request appears across feedback sources. For example, a login issue mentioned 42 times in support tickets and in-app feedback carries more weight than a one-off idea.
Impact: The severity of the problem and its effect on user success, retention, or revenue. A low-frequency issue that blocks onboarding or core workflows can score high here.
Strategic alignment: How closely the feedback aligns with current product goals, positioning, or target segments. A request that supports a key initiative should rank higher than one that pulls the product off course.
Effort: The estimated time, complexity, and risk required to deliver a solution. This keeps prioritization grounded in delivery constraints.
In practice, teams often capture these factors in a simple table with one row per theme, then compare relative scores instead of chasing perfect numbers. The value comes from the conversation the framework enables, not the math itself.
How Frill helps teams prioritize transparently
Frill’s prioritization matrix turns user feedback into a shared, visual decision-making tool instead of a private spreadsheet or gut call. It gives product teams a consistent way to evaluate feature requests using real user data and clearly defined criteria.

Built-in prioritization matrix: Frill plots feature requests on a benefits-versus-costs matrix so teams can quickly identify quick wins, high-impact projects, and low-value distractions.
Custom benefit and cost factors: Teams define what “value” means for their product by adding weighted factors like reach, impact, confidence, votes, effort, urgency, or revenue influence.
Support for multiple frameworks: Frill supports common models such as RICE, value vs effort, urgent vs important, and fully custom weighted scoring, all powered by the same underlying matrix.
Real user feedback as inputs: Every data point comes from actual feature requests, not abstract estimates, which keeps prioritization grounded in user reality.
Shared visibility across teams: Product, support, and leadership see the same matrix, scores, and tradeoffs, reducing misalignment.
Because the matrix is automated and tied directly to incoming feedback, teams spend less time debating scores and more time discussing strategy. Decisions become easier to explain internally and externally, since every priority can be traced back to clear criteria and real user demand.

Step 6. Close the feedback
Users stop giving feedback when it feels like shouting into the void. The fix isn't complicated: tell people what happened with their input. You don't need to build every request. You just need to acknowledge it and explain your decision.
Close the loop in three ways. First, update users when their request ships. Second, explain why something isn't happening now or at all. Third, make progress visible through public roadmaps or changelogs. Tools like Frill automate this by linking feedback to updates and notifying users when status changes.
The result is better feedback quality over time. When users see their input matters, they give more context, report real problems instead of symptoms, and trust your prioritization. Closing the loop transforms feedback from a one-way complaint box into an ongoing conversation that strengthens your product decisions.
Examples of user feedback analysis in action
Seeing the process in theory is helpful. Seeing what it could look like in practice is what makes it click. The following examples illustrate realistic outcomes product teams often experience after applying structured user feedback analysis at scale.
Example #1. Feature requests overwhelming the product team
In our first example, a mid-sized SaaS product receives constant feature requests spread across support tickets, sales CRM notes, in-app feedback, and leadership emails.
Before: Scattered requests and gut-driven decisions
Imagine a mid-sized SaaS product with a growing user base and an active roadmap. Feature requests arrive constantly, but they’re spread across systems:
Support tickets reference missing features in passing
Sales logs requests in the CRM with little detail
In-app feedback captures raw ideas without context
Leadership forwards emails labeled “important”
Product managers skim requests weekly, pull a few notable ones into a document, and make prioritization calls based on memory, urgency, and stakeholder pressure. The result feels busy but unclear.
Common symptoms:
The same feature discussed multiple times without realizing it
Roadmap debates that rely on opinions instead of data
Teams unsure why certain features were prioritized
Users feeling ignored because feedback disappears
After: Centralized feedback and a confident roadmap
Now imagine the same team centralizes all feature requests in Frill. Every request, regardless of source, lands in one place and follows the same workflow.
They:
Apply consistent tags for problem, feature area, and user segment
Group requests into themes instead of reviewing them individually
Use Frill’s prioritization matrix to score themes by impact, effort, and alignment
Within weeks, patterns emerge. What felt like dozens of unrelated requests resolves into a few high-impact opportunities. One theme alone accounts for 28% of all requests across three channels.
The outcome:
A roadmap backed by real user demand
Faster prioritization with fewer internal debates
Clear explanations for why features are in or out
Users seeing progress and trusting the feedback process
Example #2. Support tickets revealing a retention risk
In our second example, a SaaS team has stable growth and manageable support volume, but feedback is buried.
Before: Treating support tickets as isolated problems
Consider a SaaS team with stable growth and steady churn that doesn’t raise alarms. Support volume is manageable, and most tickets get resolved quickly. On the surface, everything looks fine.
But buried in support conversations are recurring frustrations:
Users asking how to complete the same setup step
Confusion around permissions and access
Requests for “just a quick walkthrough”
Individually, these tickets feel minor. Each one gets closed with a response or a help doc link. Because they’re logged only in the support tool, product rarely sees the full picture. No single ticket feels urgent enough to prioritize, so the underlying issue goes unnoticed.
After: Surfacing a usability issue through feedback analysis
Now imagine the team starts pulling support tickets into a shared feedback system and tagging them by workflow, sentiment, and user segment. Over time, a pattern becomes clear. Nearly 40% of support tickets from new accounts relate to the same onboarding step.
Qualitative comments reveal the real problem. Users aren’t confused because the feature is complex. They’re confused because the UI assumes prior context they don’t have.
The team groups these tickets into a single theme and plots it in their prioritization matrix. While the request volume isn’t massive, the impact is. Affected users are disproportionately new customers within their first 30 days.
Turning complaints into a roadmap win
Instead of patching documentation, the team prioritizes a small onboarding redesign. The work fits cleanly into an upcoming sprint and aligns with a retention-focused quarterly goal.
The result:
Fewer repeat support tickets
Faster time-to-value for new users
Improved early retention metrics
Clear evidence that “small” feedback can signal big risks
This is what happens when qualitative feedback isn’t dismissed as noise, but analyzed as a leading indicator of churn.
Common user feedback analysis mistakes (and how to avoid them)
You don't want to make these mistakes. Give these a read to put them on your radar.
1. Treating feedback as a voting contest
Votes are useful, but they are not a decision engine. When teams prioritize purely by vote count, they often favor popular ideas over meaningful ones. This approach overlooks context, user segments, and impact. Use votes as a signal, not the final answer, and always pair them with qualitative insight.
2. Over-indexing on loud users
Some users give more feedback than others. That does not make them more representative. Power users, frustrated customers, and internal stakeholders can easily dominate the conversation. Good analysis looks at patterns across segments instead of reacting to the most vocal voices.
3. Ignoring qualitative nuance
Summarizing feedback too aggressively can erase important details. Users rarely describe problems in product terms. They talk about friction, confusion, or workarounds. Ignoring that language leads to shallow conclusions and misdiagnosed problems.
4. Tagging everything differently
Inconsistent tagging makes analysis unreliable. When similar feedback is labeled in different ways, themes never fully form. A small, shared tagging framework creates cleaner data and clearer trends over time.
5. Collecting feedback without closing the loop
When users never hear back, they stop giving feedback. Closing the loop builds trust and encourages better input. Even a simple update explaining a decision helps users feel heard and keeps the feedback system healthy.
Building a sustainable feedback analysis system
Feedback analysis only works if it becomes routine. Most teams start strong, then drift back to reactive mode when priorities shift. The difference between teams that sustain it and teams that don't comes down to ownership, cadence, and knowing when to automate.
Someone needs to own feedback analysis, and it's usually product. That doesn't mean doing all the work. It means ensuring feedback gets reviewed, tagged, and turned into themes consistently. Support and success should contribute context. Leadership should trust the system enough to reference it in roadmap conversations.
Set a predictable rhythm:
Weekly reviews to tag new feedback and spot emerging patterns
Monthly rollups to share key themes with stakeholders
Quarterly deep dives to assess trends and validate priorities
Automation helps with aggregation, tagging suggestions, and sentiment detection. It speeds up the mechanics. But it doesn't replace judgment. AI can surface patterns, but it can't decide what matters to your strategy or which segment to prioritize. Use tools to reduce manual work, not to outsource thinking. When feedback analysis has clear ownership and runs on a regular schedule, it stops feeling like extra work and starts driving better decisions by default.
7 tools for user feedback analysis
These are the top platforms to support your analysis and prioritization of user feedback.
1. Frill
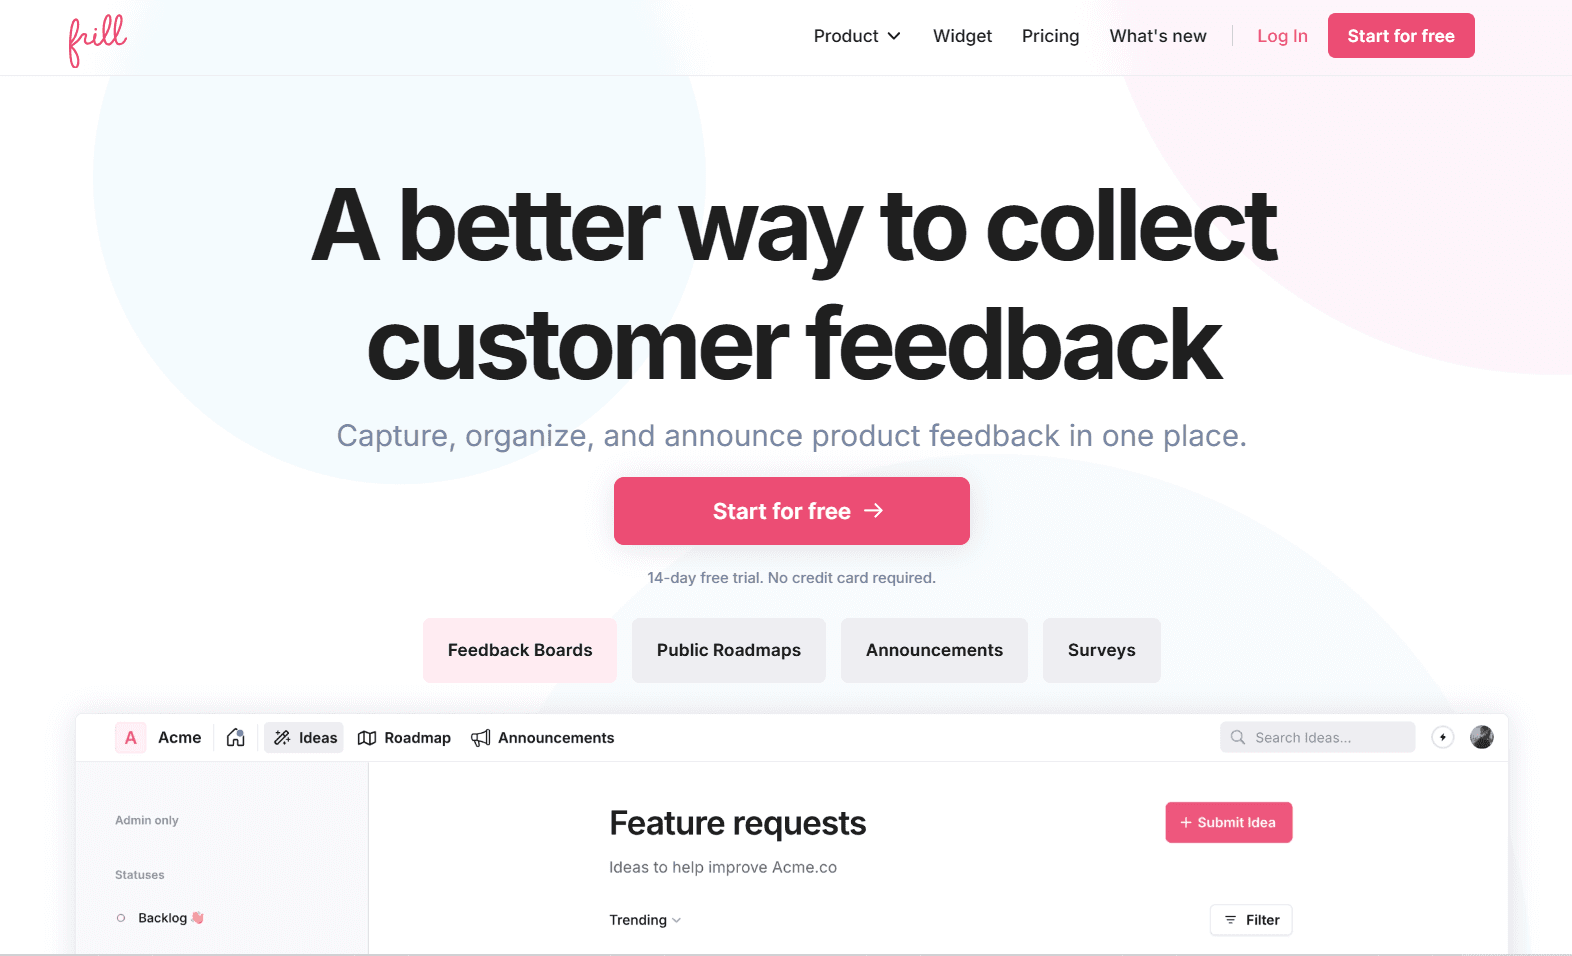
Frill is a complete user feedback platform built for SaaS teams who want to centralize requests, analyze patterns, and prioritize transparently. It combines feedback collection, tagging, prioritization matrices, and roadmap communication in one system. Teams use Frill to replace scattered spreadsheets and siloed tools with a single source of truth that connects user input directly to product decisions. The platform emphasizes clarity and speed, making it easy for product managers to move from raw feedback to confident roadmap choices.
Key features:
Centralized feedback widget and portal
Customizable tagging framework
Built-in prioritization matrix with RICE and custom scoring
Public roadmaps with automatic user notifications
Support ticket and CRM integrations
Team collaboration and internal notes
2. Productboard
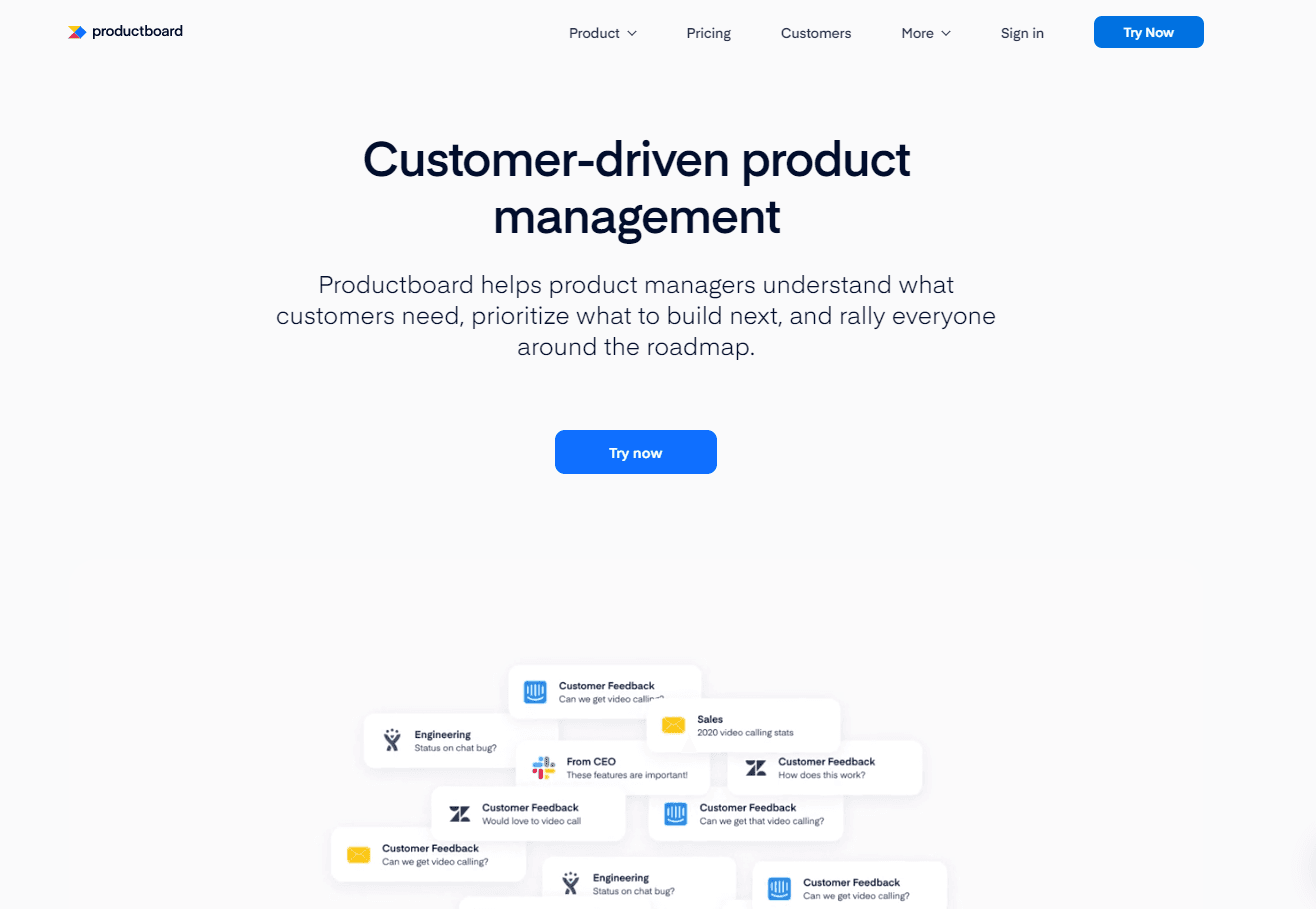
Productboard is a product management platform designed to help teams understand what to build next by organizing customer feedback alongside strategic objectives. It offers robust integrations with support and sales tools, making it easier to capture input from across the organization. The platform excels at connecting user insights to roadmap planning through scoring frameworks and custom views. Productboard works well for larger teams that need alignment across product, sales, and customer success.
Key features:
Feedback inbox with deduplication
User segmentation and impact scoring
Roadmap planning and prioritization frameworks
Portal for public feature requests
Integrations with Salesforce, Intercom, Zendesk, and Slack
Custom hierarchy for organizing features and initiatives
3. Canny
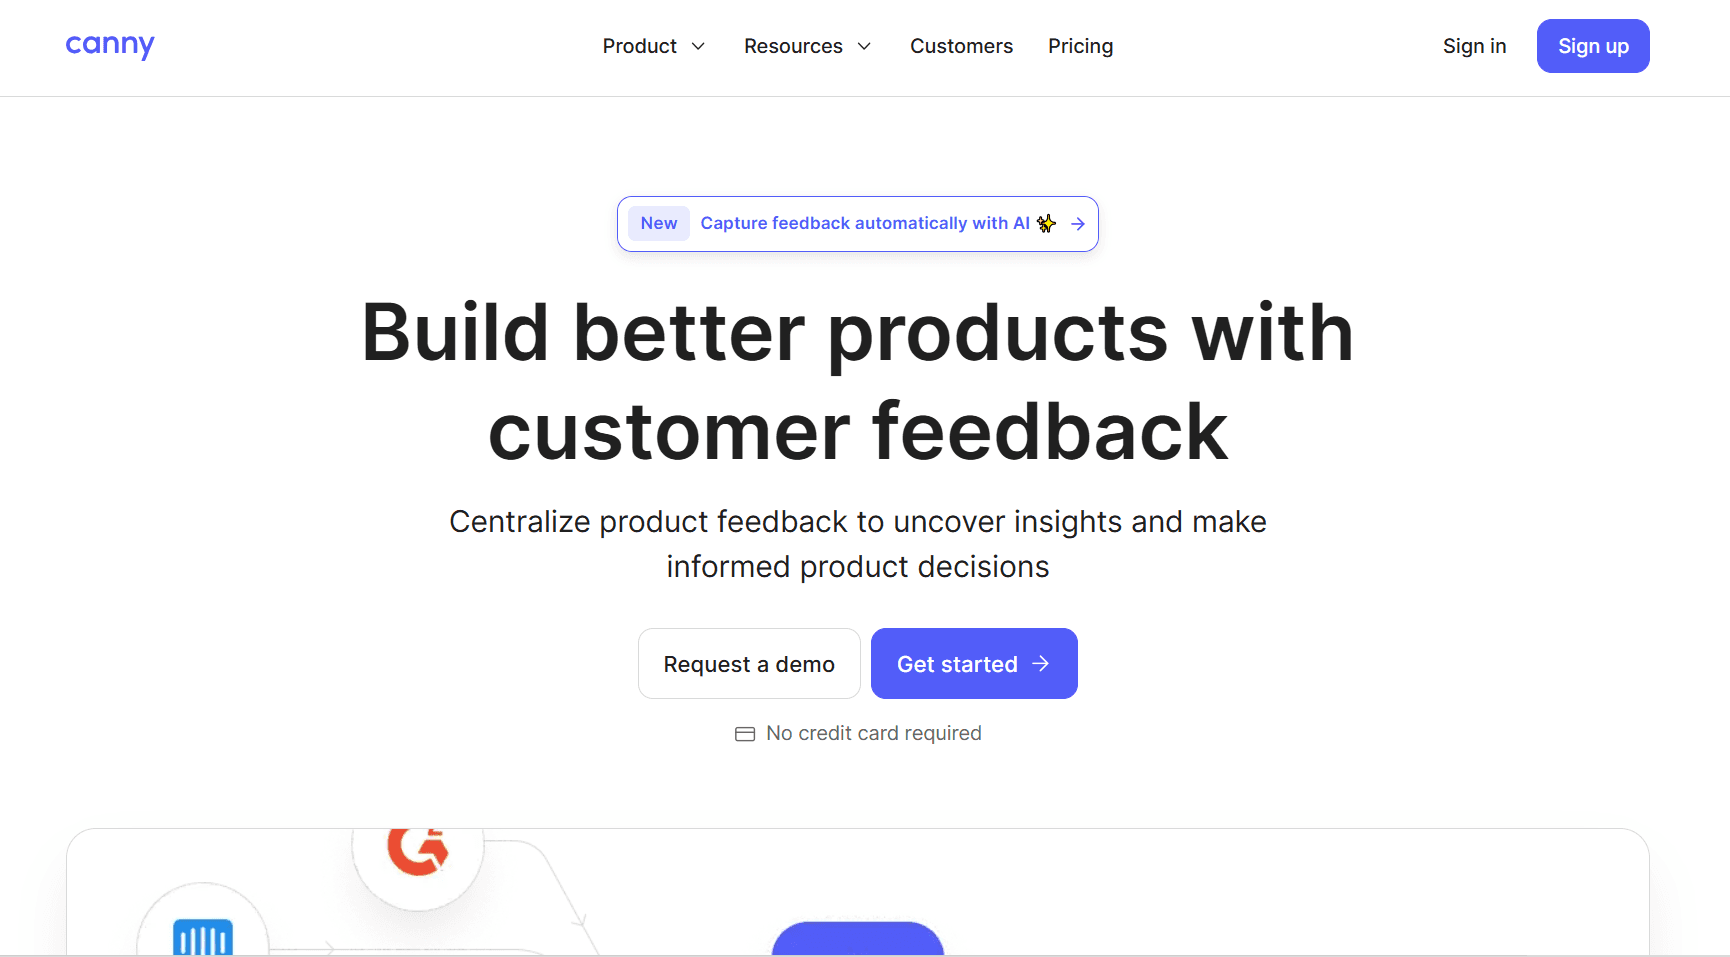
Canny specializes in collecting and organizing feature requests through public boards where users can vote and comment. It's designed to reduce noise by surfacing what customers actually want rather than relying on scattered emails. The platform makes it simple to close the feedback loop by posting updates and linking shipped features back to original requests. Canny works particularly well for early-stage and mid-market SaaS companies that want lightweight, user-facing feedback management.
Key features:
Public voting boards and private feedback tracking
Automatic duplicate detection
Changelog and release notes
User segmentation by plan or custom attributes
Integrations with help desks and project management tools
SSO and advanced permissions for team access
4. UserVoice
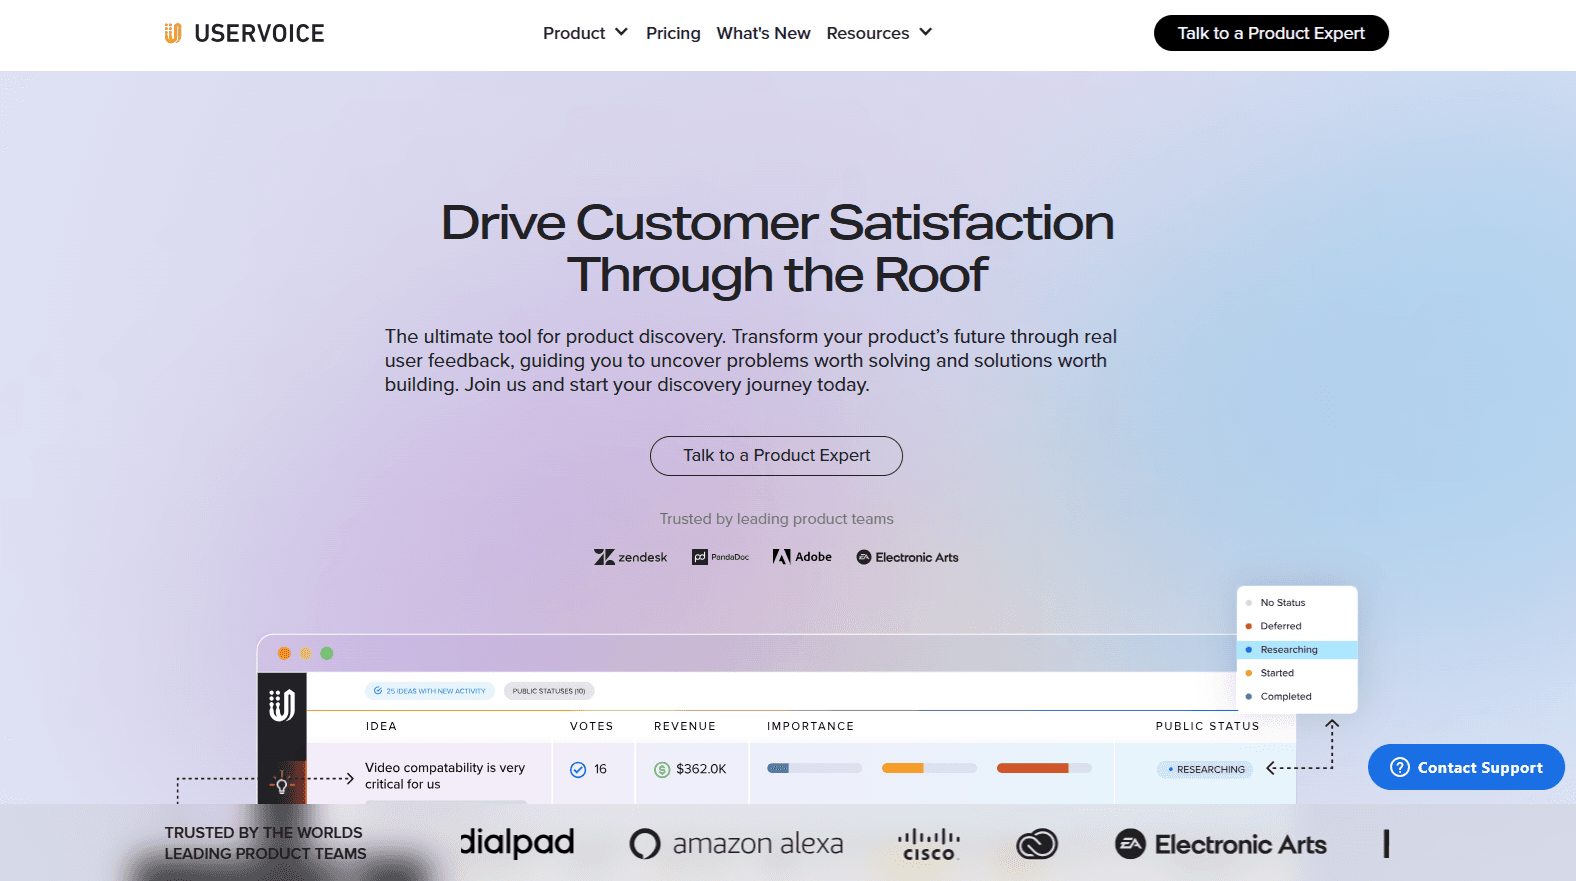
UserVoice is an established feedback management tool that helps product teams collect, prioritize, and communicate around feature requests. It offers flexible voting systems, internal scoring, and roadmap sharing to keep users informed. The platform supports both public-facing idea portals and private internal workflows, making it adaptable for different use cases. UserVoice fits teams that need a proven system with enterprise-grade security and permissions but may feel heavier than newer alternatives.
Key features:
Idea portals with voting and commenting
Custom scoring and prioritization models
Internal feedback tracking from support and sales
Roadmap visibility and status updates
Integrations with Salesforce, Jira, and Zendesk
Advanced admin controls and user segmentation
5. Dovetail

Dovetail is a qualitative research platform built to analyze customer interviews, surveys, support tickets, and unstructured feedback at scale. It uses AI to surface themes, tag patterns, and generate insights from large volumes of text. Teams use Dovetail when deep qualitative analysis matters more than voting or prioritization. It's ideal for research-heavy organizations that run frequent user interviews and want to centralize findings in one searchable repository.
Key features:
AI-powered tagging and theme detection
Transcription and highlight reels from interviews
Sentiment analysis across feedback sources
Collaborative analysis workspace
Integration with survey tools, support platforms, and Slack
Insight repositories with search and filtering
6. Pendo

Pendo combines product analytics with in-app feedback collection, allowing teams to see both what users do and what they say. The platform captures feature requests directly inside the product and ties them to usage data and user segments. This dual approach helps teams validate whether complaints align with actual behavior. Pendo works best for teams that want feedback and analytics in one place and need robust tools for segmentation and in-app messaging.
Key features:
In-app feedback widgets and surveys
Product usage analytics and funnels
User segmentation by behavior and attributes
Roadmap sharing and feature voting
Guides and tooltips for onboarding
Integrations with CRMs, support tools, and data warehouses
7. Typeform
Typeform is a survey and form builder known for its conversational interface and high completion rates. While not a dedicated feedback analysis tool, it's widely used to collect structured user input through NPS surveys, feature preference questionnaires, and onboarding interviews. Teams often pair Typeform with other tools to analyze responses. It's a strong choice when you need beautifully designed surveys that feel less corporate and more engaging than traditional forms.
Key features:
Conversational survey flows with logic jumps
NPS, CSAT, and custom question types
Embedded forms and shareable links
Integrations with Slack, Google Sheets, and CRMs
Response analytics and export options
Video and image support in questions
For more details on these tools and additional options, check out our guide to user feedback analysis software.
FAQ
Get answers to important questions
What is user feedback analysis?
User feedback analysis is the systematic process of reviewing, organizing, and interpreting feedback from users to identify patterns and actionable insights. It transforms raw comments, requests, and complaints into structured data that guides product decisions, prioritization, and roadmap planning with confidence.
How do you analyze qualitative user feedback at scale?
Centralize feedback in one system, apply consistent tags to categorize input, then group tagged feedback into recurring themes instead of reading individual comments. Use tools that support tagging and filtering so patterns become visible across hundreds or thousands of responses without manual review.
What’s the difference between customer feedback and user feedback?
User feedback comes from anyone interacting with your product. Customer feedback comes from paying users. In SaaS, they often overlap, but not always. Power users may surface usability issues while buyers focus on pricing or reporting. Good analysis considers both perspectives without treating every request equally.
How often should teams analyze user feedback?
Review and tag new feedback weekly to catch emerging patterns early. Share key themes with stakeholders monthly. Conduct deeper quarterly reviews to assess trends over time and validate priorities. Consistent cadence prevents reactive decisions and keeps feedback analysis from becoming a one-time project.
Can AI replace manual user feedback analysis?
No. AI helps with tagging suggestions, sentiment detection, and surfacing patterns, but it can't replace strategic judgment. It speeds up mechanics like categorization and aggregation but doesn't understand your product strategy, user segments, or business priorities. Use AI to reduce manual work, not to outsource decision-making.
What’s the best tool for user feedback analysis in SaaS?
Frill is purpose-built for SaaS teams who want centralized feedback collection, structured tagging, prioritization matrices, and roadmap communication in one platform. Productboard works well for larger teams needing cross-functional alignment. Canny suits early-stage companies prioritizing lightweight voting boards. Choose based on team size and workflow needs.
When feedback analysis becomes routine, product decisions get faster, roadmaps become easier to defend, and teams spend less time debating opinions and more time building what matters.
If you're ready to move from spreadsheets and scattered input to a system that actually works, try Frill.

Dayana Mayfield
Dayana Mayfield is a B2B SaaS copywriter who believes in the power of content marketing and a good smoothie. She lives in Northern California.